APOD: MAVEN's Ultraviolet Mars (2023 Jun 27)

Comments and questions about the APOD on the main view screen.
Post Reply
User avatar
APOD Robot
Otto Posterman
Posts: 5601
Joined: Fri Dec 04, 2009 3:27 am
Contact:

APOD: MAVEN's Ultraviolet Mars (2023 Jun 27)

Post by APOD Robot » Tue Jun 27, 2023 4:06 am

Image MAVEN's Ultraviolet Mars

Explanation: These two global views of Mars were captured at ultraviolet wavelengths, beyond the spectrum visible to human eyes. Recorded by the MAVEN spacecraft's Imaging Ultraviolet Spectrograph instrument in July 2022 (left) and January 2023, three otherwise invisible ultraviolet bands are mapped into red, green, and blue colors. That color scheme presents the Red Planet's surface features in shades of tan and green. Haze and clouds appear white or blue, while high altitude ozone takes on a dramatic purple hue. On the left, Mars' south polar ice cap is in brilliant white at the bottom but shrinking during the southern hemisphere's summer season. On the right, the northern hemisphere's polar region is seen shrouded in clouds and atmospheric ozone. Known to some as the Mars Atmosphere and Volatile EvolutioN spacecraft, MAVEN has been exploring Mars' tenuous upper atmosphere, ionosphere, and its interactions with the Sun and solar wind since 2014.

<< Previous APOD This Day in APOD Next APOD >>

User avatar
Ann
4725 Å
Posts: 13865
Joined: Sat May 29, 2010 5:33 am

Re: APOD: MAVEN's Ultraviolet Mars (2023 Jun 27)

Post by Ann » Tue Jun 27, 2023 4:34 am

MavenMars2panel[1].png
MAVEN's Ultraviolet Mars
Image Credit: MAVEN, Laboratory for Atmospheric and Space Physics, Univ. Colorado, NASA
APOD Robot wrote:

Recorded by the MAVEN spacecraft's Imaging Ultraviolet Spectrograph instrument in July 2022 (left) and January 2023, three otherwise invisible ultraviolet bands are mapped into red, green, and blue colors. That color scheme presents the Red Planet's surface features in shades of tan and green. Haze and clouds appear white or blue, while high altitude ozone takes on a dramatic purple hue.

Note that we don't get to know what the mapped colors represent. Do the colors represent intensity or wavelength? Why does Mars look very green in the picture at right, but not nearly so green in the picture at left? Why is there an enormous purple splotch in the picture at right, but no sign of purple whatsoever in the picture at left? Is Mars brighter in ultraviolet light in the picture at right than in the picture at left? If so, is there a reason why?

Mars' atmosphere doesn't protect Mars from the ultraviolet light from the Sun, but the Earth's atmosphere does a good job of protecting the Earth. Does that mean that the surface of Mars is brighter in ultraviolet light than the surface (including the oceans) of the Earth?

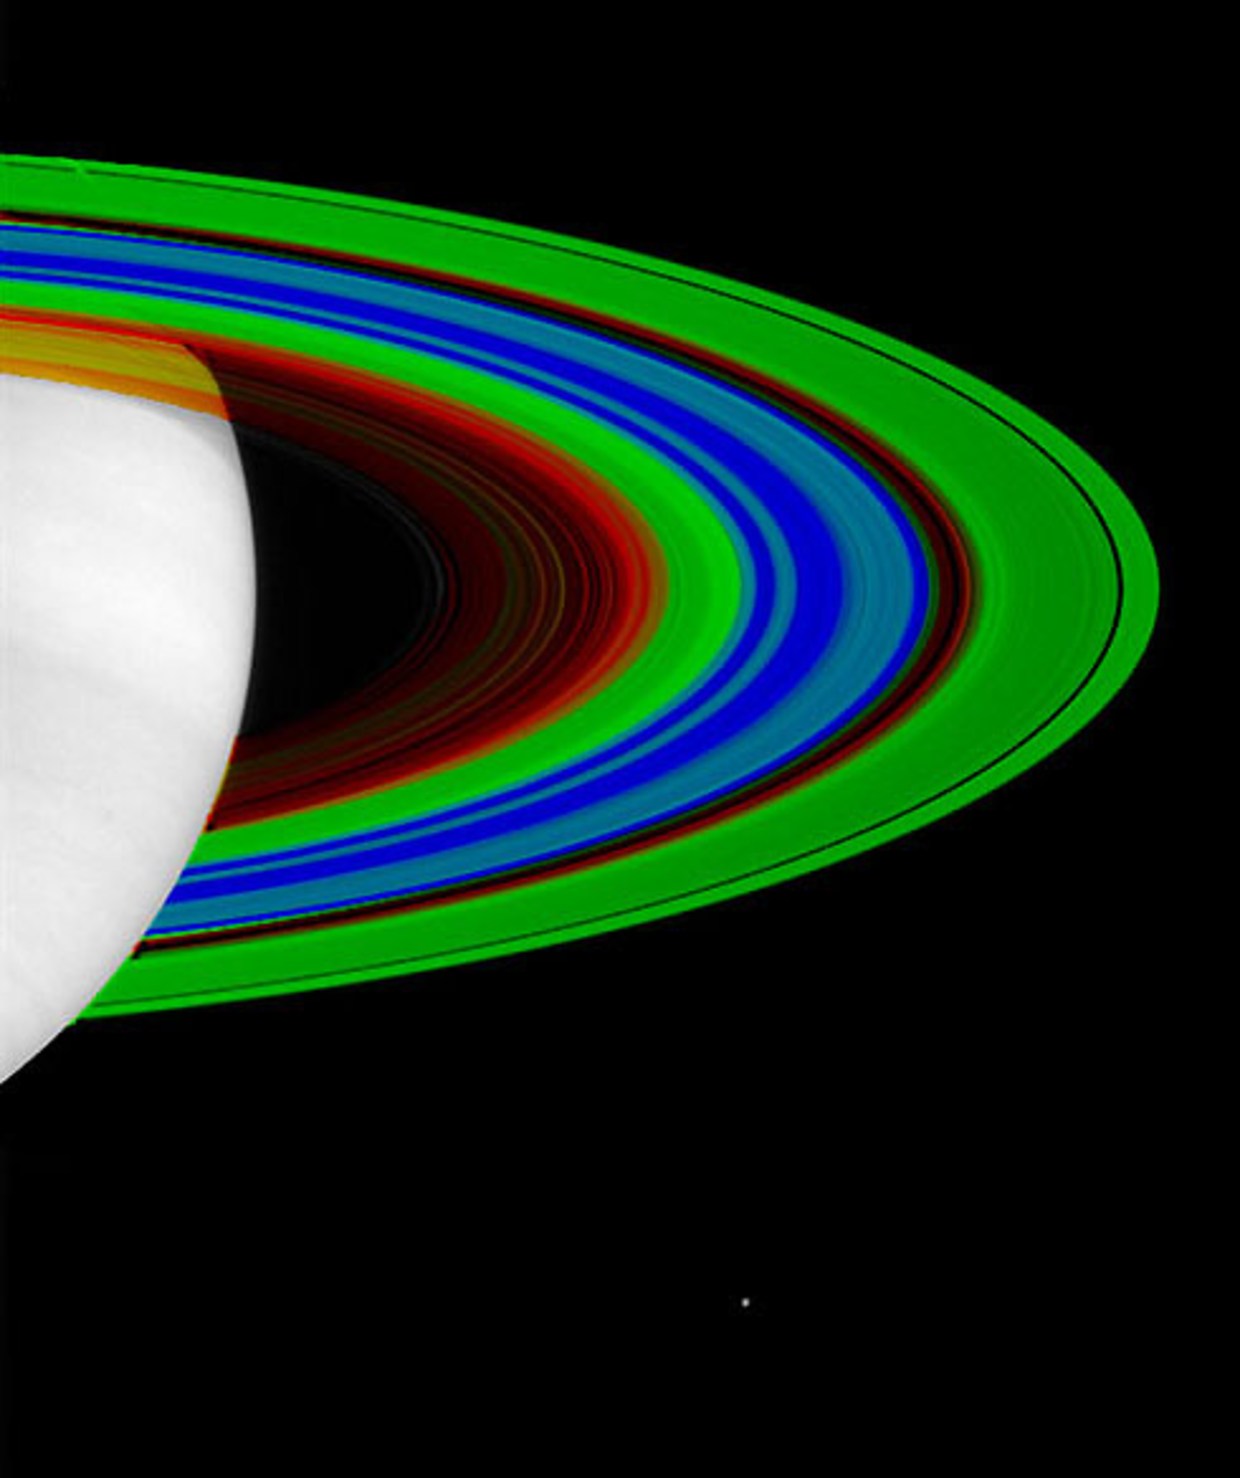
I'm not a great fan of mapped color, but mapped color works if the colors are explained. Take a look at the picture below of Saturn's rings in mapped color, and read the great explanation of the colors of the rings:

NBC News wrote:

Newly released imagery from the Cassini spacecraft shows just how cool the giant planet's rings really are.

The false-color reading is color-coded to reflect temperature data from Cassini's Composite Infrared Spectrometer. In its description of the imagery, NASA said Thursday that the data represents "the most detailed look to date at the temperature of Saturn's rings."

Red represents temperatures of 261 degrees below zero Fahrenheit (110 degrees Kelvin), and the blue areas are even colder — minus-333 degrees F (70 degrees K). Green is equivalent to minus-298 degrees F (90 degrees K). The Kelvin temperature scale is used to measure very cold substances; zero corresponds to absolute zero, and the freezing point of water is 273 degrees K.
Well, there you have it, clear as day. So please, if you are going to publish mapped color images, please explain to us what the colors mean!

Ann
Color Commentator

User avatar
MarkBour
Subtle Signal
Posts: 1377
Joined: Mon Aug 26, 2013 2:44 pm
Location: Illinois, USA

Re: APOD: MAVEN's Ultraviolet Mars (2023 Jun 27)

Post by MarkBour » Tue Jun 27, 2023 7:02 am

Ann wrote: Tue Jun 27, 2023 4:34 am
Image
MAVEN's Ultraviolet Mars
Image Credit: MAVEN, Laboratory for Atmospheric and Space Physics, Univ. Colorado, NASA
APOD Robot wrote:

Recorded by the MAVEN spacecraft's Imaging Ultraviolet Spectrograph instrument in July 2022 (left) and January 2023, three otherwise invisible ultraviolet bands are mapped into red, green, and blue colors. That color scheme presents the Red Planet's surface features in shades of tan and green. Haze and clouds appear white or blue, while high altitude ozone takes on a dramatic purple hue.
Note that we don't get to know what the mapped colors represent. Do the colors represent intensity or wavelength? Why does Mars look very green in the picture at right, but not nearly so green in the picture at left? Why is there an enormous purple splotch in the picture at right, but no sign of purple whatsoever in the picture at left? Is Mars brighter in ultraviolet light in the picture at right than in the picture at left? If so, is there a reason why?

Mars' atmosphere doesn't protect Mars from the ultraviolet light from the Sun, but the Earth's atmosphere does a good job of protecting the Earth. Does that mean that the surface of Mars is brighter in ultraviolet light than the surface (including the oceans) of the Earth?

I'm not a great fan of mapped color, but mapped color works if the colors are explained.

. . . (counterexample followed) . . .

Well, there you have it, clear as day. So please, if you are going to publish mapped color images, please explain to us what the colors mean!

Ann
You're quite right, I say! More explanation would be nice.

I did find this: https://lasp.colorado.edu/maven/files/2 ... N_IUVS.pdf
That PDF is titled: "The Imaging Ultraviolet Spectrograph (IUVS) for the MAVEN Mission"
Authored by: William E. McClintock · Nicholas M. Schneider · Gregory M. Holsclaw · John T. Clarke ·
Alan C. Hoskins · Ian Stewart · Franck Montmessin · Roger V. Yelle · Justin Deighan

Now 50 pages of explanation is probably more than you wanted. But there is a nice diagram in it with a helpful caption.
Capture.PNG
I think it applies to the two images for today's APOD. In which case the map is: 310nm -> red, 255nm -> green, 130nm -> blue.
Then the lower pictures in the diagram show how a composite is made and describe some of the features that become evident in such composites.

If I'm piecing this together correctly, then both of the two images in today's APOD were made in the same manner. But they show the striking difference in the features over time. The left image was taken at a Martian perihelion in 2022 and the right image near Martian aphelion in 2023. The reason only one of the two images has a large purple area is that only in that shot did Mars have a lot of ozone build up in its atmosphere. The project scientists may have figured out why, or when to expect more or less ozone, but that is beyond me.

A simple idea would be that ozone builds up when Mars is farther from the sun, but I'm really speculating on just this shred of data, so it's unlikely to be that simple. It's true that Mars' orbit is a lot more eccentric than Earth's, so it may do a lot more to create global seasons than do the perihelion and aphelion of Earth which (I think) have very little effect on our global average temperature (at least over short terms).
Mark Goldfain

User avatar
MarkBour
Subtle Signal
Posts: 1377
Joined: Mon Aug 26, 2013 2:44 pm
Location: Illinois, USA

Re: APOD: MAVEN's Ultraviolet Mars (2023 Jun 27)

Post by MarkBour » Tue Jun 27, 2023 7:33 am

Actually, something doesn't seem right in the description in the first link from today's APOD caption.
The link goes to: https://www.nasa.gov/feature/goddard/20 ... red-planet .

So this article is NASA's own publication of today's APOD. But it says that Mars was near perihelion in July 2022 and just past aphelion in January 2023.
Since Mars' orbit is about 2 (Earth) years long, how does it get from perihelion to aphelion in 6 months?
Mark Goldfain

User avatar
johnnydeep
Commodore
Posts: 3249
Joined: Sun Feb 20, 2011 8:57 pm

Re: APOD: MAVEN's Ultraviolet Mars (2023 Jun 27)

Post by johnnydeep » Tue Jun 27, 2023 1:55 pm

In addition to the others' desire that there should have been more explanation of what the colors mean, I'll add my own perhaps obvious question: given the mapped color scheme, why does the south polar cry ice cap appear brilliantly white? Simply because it reflects almost all incident light?
--
"To B̬̻̋̚o̞̮̚̚l̘̲̀᷾d̫͓᷅ͩḷ̯᷁ͮȳ͙᷊͠ Go......Beyond The F͇̤i̙̖e̤̟l̡͓d͈̹s̙͚ We Know."{ʲₒʰₙNYᵈₑᵉₚ}

User avatar
Chris Peterson
Abominable Snowman
Posts: 18612
Joined: Wed Jan 31, 2007 11:13 pm
Location: Guffey, Colorado, USA
Contact:

Re: APOD: MAVEN's Ultraviolet Mars (2023 Jun 27)

Post by Chris Peterson » Tue Jun 27, 2023 2:18 pm

Ann wrote: Tue Jun 27, 2023 4:34 am Note that we don't get to know what the mapped colors represent. Do the colors represent intensity or wavelength?
Both. Because "color" is a combination of the two. The color in images like this serves to draw our attention to interesting features, but that's where it ends. If you want to know what's going on, you need to look at the individual channels. See a big blob of purple at the top? Wow, something is going on there! But what? For that we look at the intensity ratios between each of the three channels (which are presumably monotonically mapped, as the document Mark found suggests) to determine something about the underlying physics and chemistry of the reflecting material.
Chris

*****************************************
Chris L Peterson
Cloudbait Observatory
https://www.cloudbait.com

User avatar
VictorBorun
Captain
Posts: 1143
Joined: Fri Oct 16, 2020 10:25 pm
Contact:

Re: APOD: MAVEN's Ultraviolet Mars (2023 Jun 27)

Post by VictorBorun » Tue Jun 27, 2023 2:23 pm

MarkBour wrote: Tue Jun 27, 2023 7:02 am
Ann wrote: Tue Jun 27, 2023 4:34 am
Image
MAVEN's Ultraviolet Mars
Image Credit: MAVEN, Laboratory for Atmospheric and Space Physics, Univ. Colorado, NASA
APOD Robot wrote:

Recorded by the MAVEN spacecraft's Imaging Ultraviolet Spectrograph instrument in July 2022 (left) and January 2023, three otherwise invisible ultraviolet bands are mapped into red, green, and blue colors. That color scheme presents the Red Planet's surface features in shades of tan and green. Haze and clouds appear white or blue, while high altitude ozone takes on a dramatic purple hue.
Note that we don't get to know what the mapped colors represent. Do the colors represent intensity or wavelength? Why does Mars look very green in the picture at right, but not nearly so green in the picture at left? Why is there an enormous purple splotch in the picture at right, but no sign of purple whatsoever in the picture at left? Is Mars brighter in ultraviolet light in the picture at right than in the picture at left? If so, is there a reason why?

Mars' atmosphere doesn't protect Mars from the ultraviolet light from the Sun, but the Earth's atmosphere does a good job of protecting the Earth. Does that mean that the surface of Mars is brighter in ultraviolet light than the surface (including the oceans) of the Earth?

I'm not a great fan of mapped color, but mapped color works if the colors are explained.

. . . (counterexample followed) . . .

Well, there you have it, clear as day. So please, if you are going to publish mapped color images, please explain to us what the colors mean!

Ann
You're quite right, I say! More explanation would be nice.

I did find this: https://lasp.colorado.edu/maven/files/2 ... N_IUVS.pdf
That PDF is titled: "The Imaging Ultraviolet Spectrograph (IUVS) for the MAVEN Mission"
Authored by: William E. McClintock · Nicholas M. Schneider · Gregory M. Holsclaw · John T. Clarke ·
Alan C. Hoskins · Ian Stewart · Franck Montmessin · Roger V. Yelle · Justin Deighan

Now 50 pages of explanation is probably more than you wanted. But there is a nice diagram in it with a helpful caption.

Capture.PNG

I think it applies to the two images for today's APOD. In which case the map is: 310nm -> red, 255nm -> green, 130nm -> blue.
Then the lower pictures in the diagram show how a composite is made and describe some of the features that become evident in such composites.

If I'm piecing this together correctly, then both of the two images in today's APOD were made in the same manner. But they show the striking difference in the features over time. The left image was taken at a Martian perihelion in 2022 and the right image near Martian aphelion in 2023. The reason only one of the two images has a large purple area is that only in that shot did Mars have a lot of ozone build up in its atmosphere. The project scientists may have figured out why, or when to expect more or less ozone, but that is beyond me.

A simple idea would be that ozone builds up when Mars is farther from the sun, but I'm really speculating on just this shred of data, so it's unlikely to be that simple. It's true that Mars' orbit is a lot more eccentric than Earth's, so it may do a lot more to create global seasons than do the perihelion and aphelion of Earth which (I think) have very little effect on our global average temperature (at least over short terms).
to make ozon purple (=anti-green), you do need to map ozone UV absorption peak to rgb Green
UV-absorption spectrum of O 3 with maximum at 254 nm.jpg

User avatar
Chris Peterson
Abominable Snowman
Posts: 18612
Joined: Wed Jan 31, 2007 11:13 pm
Location: Guffey, Colorado, USA
Contact:

Re: APOD: MAVEN's Ultraviolet Mars (2023 Jun 27)

Post by Chris Peterson » Tue Jun 27, 2023 2:35 pm

VictorBorun wrote: Tue Jun 27, 2023 2:23 pm
MarkBour wrote: Tue Jun 27, 2023 7:02 am
You're quite right, I say! More explanation would be nice.

I did find this: https://lasp.colorado.edu/maven/files/2 ... N_IUVS.pdf
That PDF is titled: "The Imaging Ultraviolet Spectrograph (IUVS) for the MAVEN Mission"
Authored by: William E. McClintock · Nicholas M. Schneider · Gregory M. Holsclaw · John T. Clarke ·
Alan C. Hoskins · Ian Stewart · Franck Montmessin · Roger V. Yelle · Justin Deighan

Now 50 pages of explanation is probably more than you wanted. But there is a nice diagram in it with a helpful caption.

Capture.PNG

I think it applies to the two images for today's APOD. In which case the map is: 310nm -> red, 255nm -> green, 130nm -> blue.
Then the lower pictures in the diagram show how a composite is made and describe some of the features that become evident in such composites.

If I'm piecing this together correctly, then both of the two images in today's APOD were made in the same manner. But they show the striking difference in the features over time. The left image was taken at a Martian perihelion in 2022 and the right image near Martian aphelion in 2023. The reason only one of the two images has a large purple area is that only in that shot did Mars have a lot of ozone build up in its atmosphere. The project scientists may have figured out why, or when to expect more or less ozone, but that is beyond me.

A simple idea would be that ozone builds up when Mars is farther from the sun, but I'm really speculating on just this shred of data, so it's unlikely to be that simple. It's true that Mars' orbit is a lot more eccentric than Earth's, so it may do a lot more to create global seasons than do the perihelion and aphelion of Earth which (I think) have very little effect on our global average temperature (at least over short terms).
to make ozon purple (=anti-green), you do need to map ozone UV absorption peak to rgb Green
UV-absorption spectrum of O 3 with maximum at 254 nm.jpg
Which is completely consistent with the suggested monotonic filter mapping here, assuming the illumination source is a continuum (which it is, given that the source is a blackbody). Ozone will absorb the most in the 255nm band, which is mapped to green. So the reflected light will be mainly red and blue, which explains why we see purple (technically, magenta).
Chris

*****************************************
Chris L Peterson
Cloudbait Observatory
https://www.cloudbait.com

User avatar
orin stepanek
Plutopian
Posts: 8200
Joined: Wed Jul 27, 2005 3:41 pm
Location: Nebraska

Re: APOD: MAVEN's Ultraviolet Mars (2023 Jun 27)

Post by orin stepanek » Tue Jun 27, 2023 3:53 pm

MavenMars2panel.png
WOW! Mars doesn't really have a big gouge in it like the UV photo implies; does it?
Orin

Smile today; tomorrow's another day!

User avatar
VictorBorun
Captain
Posts: 1143
Joined: Fri Oct 16, 2020 10:25 pm
Contact:

Re: APOD: MAVEN's Ultraviolet Mars (2023 Jun 27)

Post by VictorBorun » Tue Jun 27, 2023 5:15 pm

Chris Peterson wrote: Tue Jun 27, 2023 2:35 pm purple (technically, magenta).
I agree that calling anti-green colour purple is outdated.
Modern smartphones and even large monitors are no longer sRGB, they are UHDTV, which is closer to LMS cones of human retina.
sRGB green was in fact lime-green, and so sRGB anti-green was in fact purple-pink.
Now UHDTV green is just a little to lime off the LMS green, and so UHDTV anti-green is just a little to purple off the LMS pink.

By the way, magenta as used in printing industry is between the LMS pink and the LMS red.
I think we should use magentas as good collective name to call the pink-to-red hues.
HLS HDTV.jpg

User avatar
Ann
4725 Å
Posts: 13865
Joined: Sat May 29, 2010 5:33 am

Re: APOD: MAVEN's Ultraviolet Mars (2023 Jun 27)

Post by Ann » Wed Jun 28, 2023 3:40 am

MarkBour wrote: Tue Jun 27, 2023 7:02 am
Ann wrote: Tue Jun 27, 2023 4:34 am
Image
MAVEN's Ultraviolet Mars
Image Credit: MAVEN, Laboratory for Atmospheric and Space Physics, Univ. Colorado, NASA
APOD Robot wrote:

Recorded by the MAVEN spacecraft's Imaging Ultraviolet Spectrograph instrument in July 2022 (left) and January 2023, three otherwise invisible ultraviolet bands are mapped into red, green, and blue colors. That color scheme presents the Red Planet's surface features in shades of tan and green. Haze and clouds appear white or blue, while high altitude ozone takes on a dramatic purple hue.
Note that we don't get to know what the mapped colors represent. Do the colors represent intensity or wavelength? Why does Mars look very green in the picture at right, but not nearly so green in the picture at left? Why is there an enormous purple splotch in the picture at right, but no sign of purple whatsoever in the picture at left? Is Mars brighter in ultraviolet light in the picture at right than in the picture at left? If so, is there a reason why?

Mars' atmosphere doesn't protect Mars from the ultraviolet light from the Sun, but the Earth's atmosphere does a good job of protecting the Earth. Does that mean that the surface of Mars is brighter in ultraviolet light than the surface (including the oceans) of the Earth?

I'm not a great fan of mapped color, but mapped color works if the colors are explained.

. . . (counterexample followed) . . .

Well, there you have it, clear as day. So please, if you are going to publish mapped color images, please explain to us what the colors mean!

Ann
You're quite right, I say! More explanation would be nice.

I did find this: https://lasp.colorado.edu/maven/files/2 ... N_IUVS.pdf
That PDF is titled: "The Imaging Ultraviolet Spectrograph (IUVS) for the MAVEN Mission"
Authored by: William E. McClintock · Nicholas M. Schneider · Gregory M. Holsclaw · John T. Clarke ·
Alan C. Hoskins · Ian Stewart · Franck Montmessin · Roger V. Yelle · Justin Deighan

Now 50 pages of explanation is probably more than you wanted. But there is a nice diagram in it with a helpful caption.

Capture.PNG

I think it applies to the two images for today's APOD. In which case the map is: 310nm -> red, 255nm -> green, 130nm -> blue.
Then the lower pictures in the diagram show how a composite is made and describe some of the features that become evident in such composites.

If I'm piecing this together correctly, then both of the two images in today's APOD were made in the same manner. But they show the striking difference in the features over time. The left image was taken at a Martian perihelion in 2022 and the right image near Martian aphelion in 2023. The reason only one of the two images has a large purple area is that only in that shot did Mars have a lot of ozone build up in its atmosphere. The project scientists may have figured out why, or when to expect more or less ozone, but that is beyond me.

A simple idea would be that ozone builds up when Mars is farther from the sun, but I'm really speculating on just this shred of data, so it's unlikely to be that simple. It's true that Mars' orbit is a lot more eccentric than Earth's, so it may do a lot more to create global seasons than do the perihelion and aphelion of Earth which (I think) have very little effect on our global average temperature (at least over short terms).
Thanks, Mark. I should have thanked you before.

Ann
Color Commentator

User avatar
MarkBour
Subtle Signal
Posts: 1377
Joined: Mon Aug 26, 2013 2:44 pm
Location: Illinois, USA

Re: APOD: MAVEN's Ultraviolet Mars (2023 Jun 27)

Post by MarkBour » Sat Jul 29, 2023 12:09 am

Ann wrote: Wed Jun 28, 2023 3:40 am
Don't mention it, Ann!
VictorBorun wrote: Tue Jun 27, 2023 5:15 pm
And Victor, very interesting, I did not know that the newer TV standards show more colors as well as more pixels.
I haven't bought one yet, but they sure look gorgeous in stores.
Mark Goldfain

Post Reply