Chris Peterson wrote: ↑Wed Jun 21, 2023 8:43 pm
JWP456 wrote: ↑Wed Jun 21, 2023 8:40 pm
Chris Peterson wrote: ↑Wed Jun 21, 2023 6:39 pm
I don't see that. We're always at the center of a (nearly) circular path, and all that changes is the tilt with respect to the horizon.
I just commented because I thought jisles was talking about the apparent motion of the sun, which can be described as a function of the latitude of the place of observation and declination of the sun (and change in declination over some given time period). If one sets up an instrument such as a solar transit to follow this path (assuming the declination to not be equal to zero), the traced path or apparent motion of the sun would be a small circle if I'm not mistaken, i.e. follow a path between sunrise and sunset parallel to the earth's equator (+ or - the change in declination) rather than a great circle. Obviously I don't dispute that the trace of the plane of the ecliptic on the earth's surface is a great circle (if I'm stating that correctly), I just thought jisles was referring to apparent motion, and you and he are talking about different things.
Maybe. I simply don't understand how the concept of a small circle fits into this.
I'll try to simplify: Since the Sun's declination is essentially constant over the ~7½ hours of imagery, the Sun's declination circle is not a great circle when the horizon is flat (a great circle).
The simulated Stellarium APOD view below uses a
stereographic projection (my favorite for visual representations) which shows the Sun due south intersecting the meridian and ecliptic. Here I also displayed the equatorial grid. The horizon, ecliptic and meridian are the visible great circles. The
red dashed curve nominally traces the Sun's position /declination through the day. This path is not a great circle.
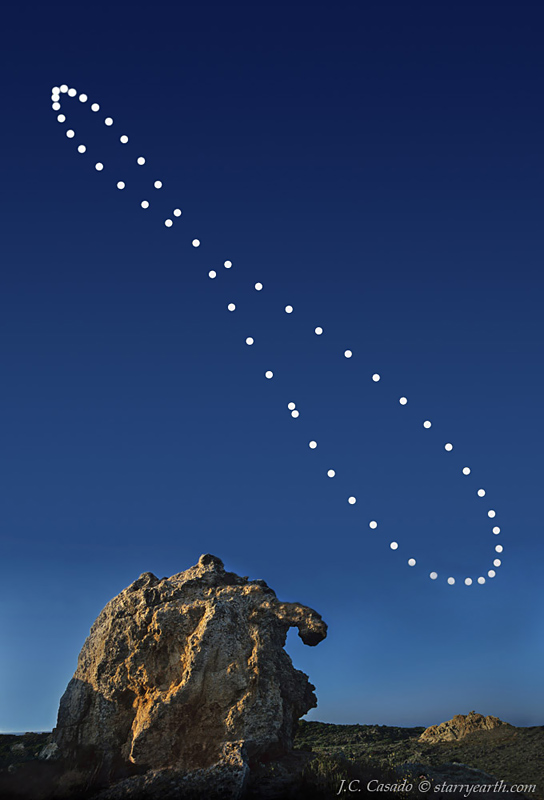
Regarding the APOD, projection and camera orientation are key drivers to apparent paths the Sun could take. In the next view, I plotted the Alt and Az in a linear X/Y plot (flat horizon) (
green curve). I aligned the beginning and ending Sun positions to be reasonably overlapped with the APOD sun positions. It's clear this X/Y plot tracks the actual APOD solstice path very well indicating a rectangular horizontal coordinate grid with little distortion.
Below is the Stellarium stereographic projection of the solstice-Sun path against the (distorted) az/alt grid. Its shape is more what I'd expect instead of a flat-top hill. As said earlier, this curve is not a great circle. Same as before, I reasonably overlapped the beginning and ending X/Y Sun positions. The curves aren't even close. For this wide-field composite image, the horizontal coordinate grid shows significant distortion from the linear X/Y grid.
Edit: Labled two plots for readability.
 Three Sun Paths