Moon River wider than a mile

Off topic discourse and banter encouraged.
Post Reply
User avatar
neufer
Vacationer at Tralfamadore
Posts: 18805
Joined: Mon Jan 21, 2008 1:57 pm
Location: Alexandria, Virginia

Moon River wider than a mile

Post by neufer » Thu Sep 02, 2010 12:37 pm

http://en.wikipedia.org/wiki/Chenab_River wrote:
Image
<<The Chenab River (literally: 'Moon(Chan) چن River(aab)' آب) is formed by the confluence of the Chandra and Bhaga rivers at Tandi located in the upper Himalayas in Himachal Pradesh, India. The Chenab then joins the Indus at Mithankot, Pakistan. The total length of the Chenab is approximately 960 kilometres. The river was known to Indians as Acesines to the Ancient Greeks. In 325 BC, Alexander the Great allegedly founded the town of Alexandria on the Indus at the confluence of the Indus and the combined stream of Punjab rivers. This river has been in the news of late due to the steps taken by the Indian government to build a number of hydro power dams along its length (in India), notably the Baglihar hydel power project(expected time of completion 2008). These planned projects on Chenab have been contested by Pakistan which says that India is breaking the terms and clauses of the Indus water treaty by storing and channeling the waters of this river.

The Chenab has the same place in the consciousness of the people of the Punjab as, say, the Rhine holds for the Germans, or the Danube for the Austrians and the Hungarians. It is the iconic river around which Punjabi consciousness revolves, and plays a prominent part in the tale of Heer Ranjha, the Punjabi national epic and the legend of Sohni Mahiwal.>>
http://earthobservatory.nasa.gov/IOTD/view.php?id=45548 wrote:
Image
Sohni Swims ("Moon River") to Meet Her Lover Mahiwal
Click to view full size image 1 or image 2

<<By late August 2010, the floodwaters that had inundated northern Pakistan slowly began to recede, although the flooding left behind a wide swath of destruction throughout the country. As of August 21, 2010, the Chenab River remained well above its normal level near the central-Pakistan city of Multan, as the top natural-color image from the Landsat 5 satellite shows. The Chenab River normally consists of braided channels near the city of Multan, as shown in the lower image from August 2, 2009. In 2010, muddy waters filled the entire riverbed and pushed outward onto the floodplain. Water on the floodplain is especially apparent near the airport, marked by the lone north-south runway. Muddy brown and green flood water covers what had been rectangular farm fields around the Taunsa-Panjnad Link canal.

Flooding is not obvious in the city of Multan, but outlying regions closer to the river were clearly affected. The Washington Post reported that throughout the country, some 1.2 million houses, 10,000 schools, 35 bridges, and nearly one-tenth of Pakistan’s national highway system had been damaged or completely destroyed. Broken sewer lines and tainted wells left millions of residents—many of them children and elderly—vulnerable to waterborne diseases. As river levels slowly fell in the north, farmers returned to mud-caked fields to find livestock dead or washed away. The torrential monsoon rains in the summer of 2010 inundated one-fifth of Pakistan—an area the size of England. Much of the submerged land was Pakistan’s prime cropland. Although fields in the north might be planted in time for the next harvest—provided farmers weren’t compelled to use their seed as food—many fields in southern Pakistan remained underwater. The flood surge pushed southward down the Indus, submerging cities near the coast.>>
Art Neuendorffer

User avatar
neufer
Vacationer at Tralfamadore
Posts: 18805
Joined: Mon Jan 21, 2008 1:57 pm
Location: Alexandria, Virginia

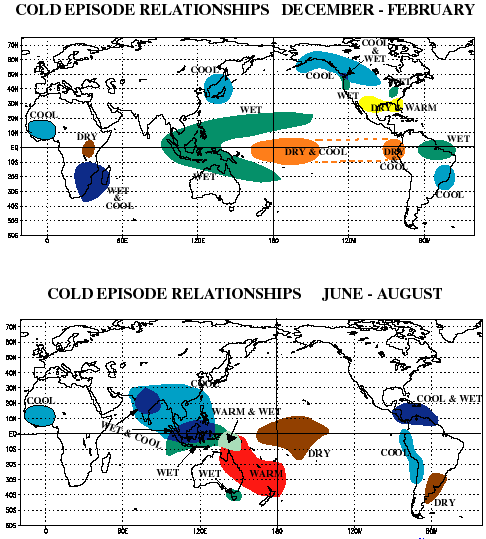
La Niña partially to blame for Pakistani flooding

Post by neufer » Wed Sep 22, 2010 9:49 pm

http://earthobservatory.nasa.gov/IOTD/view.php?id=45846 wrote:
<<Continuing a trend that began earlier in the year, La Niña conditions strengthened through the summer of 2010, evidenced by a streak of cool water across the equatorial Pacific Ocean.

Acquired by the Ocean Surface Topography Mission/Jason-2 satellite, this map shows a 10-day average of sea-surface height centered on September 6, 2010. Because water expands with rising temperatures, satellites can use sea-surface height as a proxy for temperature. Areas where the water surface is higher (and therefore warmer) than average are shades of red-brown, and areas where the water surface is lower (cooler) than average are blue. Normal conditions appear in white.

The El Niño weakens the westward trade winds that normally blow over the eastern tropical Pacific Ocean. Those winds keep eastern Pacific waters cool and concentrate warm waters in the western Pacific. A weakening of trade winds enables warm waters to gradually spread eastward, heating up the central Pacific. La Niña typically follows El Niño, and causes essentially the opposite conditions. La Niña strengthens the trade winds, spreading cool water from the South American coast to the central Pacific. This see-saw pattern of El Niño and La Niña can drive large-scale weather changes, especially in the tropics. This map reveals a broad swath of cool water stretching from South America to New Guinea.

La Niña conditions may have played a role in the devastating floods in Pakistan during the Northern Hemisphere summer of 2010.

Over the eastern Pacific Ocean, cooler waters lead to less moisture along the coasts of North and South America. So as more rain pounds some parts of the globe, La Niña conditions can deepen drought in others. By the time La Niña conditions intensified in September 2010, the southwestern United States had experienced more than 10 years of mostly dry conditions. A release from NASA’s Jet Propulsion Laboratory reported that the American Southwest might experience not only drier conditions, but also intensified wildfires under strong La Niña conditions.>>
Art Neuendorffer

User avatar
neufer
Vacationer at Tralfamadore
Posts: 18805
Joined: Mon Jan 21, 2008 1:57 pm
Location: Alexandria, Virginia

Lake Mead in need

Post by neufer » Thu Sep 23, 2010 3:10 am

http://earthobservatory.nasa.gov/IOTD/view.php?id=45945 wrote: <<In August 2010, Lake Mead reached its lowest level since 1956. The largest reservoir in the United States was straining from persistent drought and increasing human demand.

Two images from the Thematic Mapper on the Landsat 5 satellite show some of the stark changes on the eastern end of the lake since 1985. Badger Cove, Driftwood Cove, and Grand Wash Bay have receded to become valleys and channels of the Colorado River, which flows in from the east (image right). The shores around the lake display the “bathtub ring” effect, with a chalky white outline marking new shoreline where sediments had previously accumulated below the water.

Located on the Colorado River, east of Las Vegas and west of the Grand Canyon, Lake Mead provides power and water for human activities in Nevada, Arizona, southern California, and northern Mexico. The reservoir grew up behind the Hoover Dam when it was built in the 1930s, and it can hold the equivalent of the entire flow of the Colorado River for two years.

The maximum capacity of Lake Mead is 28.5 million acre-feet (35 cubic kilometers) of water, with an acre-foot equaling the amount required to cover one acre to a depth of one foot. According to records from the U.S. Bureau of Reclamation, the lake held roughly 27.8 million acre-feet of water at its high point in 1941, and levels have fluctuated through drought in the 1950s and the filling of another upstream reservoir, Lake Powell, in the 1960s.

Lake levels rose steadily through the 1980s, reaching 24.8 million acre-feet in August 1985, when the bottom image was taken. But as of August 2010 (top image), Lake Mead held 10.35 million acre-feet, just 37 percent of the lake’s capacity.

Lake Mead reached its August 2010 low after decades of population growth in the American Southwest and 12 years of persistent drought. According to the U.S. National Park Service, the amount of water flowing out of and evaporating from Lake Mead has consistently exceeded the amount of incoming water in recent years .

Approximately 800,000 acre-feet evaporate yearly, and the water flow from the upstream reaches of the Colorado River has been far below normal since the start of the drought in 1998. Refilling the lake depends almost entirely (96 percent) on snowmelt from the Rocky Mountains and how much of that water is released from dams and reservoirs in the upper basin of the Colorado (Wyoming, Colorado, Utah, and New Mexico).

Whether climate change is involved or not, there is also a historical problem at work, as described by the National Park Service: “In 1922, the states of the Colorado River Basin created the Colorado River Compact, governing how the water of the river would be divided between them. They looked at the average flow of the Colorado River over a ten-year time period. Unknowingly, they chose ten years that had a higher annual flow of water. This overabundance caused them to overestimate the amount of water available.”

The Compact called for 16.5 million acre-feet to be allocated between the U.S. and Mexico, with another 0.6 million acre-feet lost to evaporation, for a total of 17.1 million. The actual average flow of the Colorado River is approximately 14 million acre-feet per year.

Another measure of the lake's health is the lake level, or water elevation, which stood at 1,087 feet (331 meters) above sea level in late August 2010. Regional water management plans call for water restrictions to kick in when lake levels drop to 1,075 feet (328 meters). In August 1985, the lake level was 1,213 feet (370 meters).>>
Art Neuendorffer

Post Reply